 Wow! eBook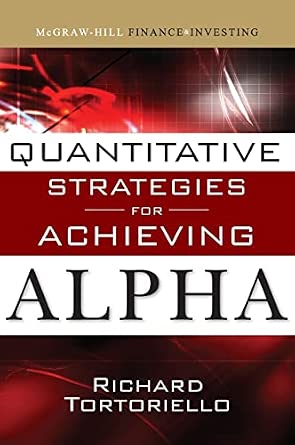
Quantitative Strategies for Achieving Alpha: The Standard and Poor's Approach to Testing Your Investment Choices
Author(s): Richard Tortoriello (Author)
- Publisher: McGraw-Hill Education
- Publication Date: 16 Nov. 2008
- Edition: Illustrated
- Language: English
- Print length: 480 pages
- ISBN-10: 0071549846
- ISBN-13: 9780071549844
Book Description
Alpha, higher-than-expected returns generated by an investment strategy, is the holy grail of the investment world. Achieve alpha, and you’ve beaten the market on a risk-adjusted basis. Quantitative Strategies for Achieving Alpha was borne from equity analyst Richard Tortoriello’s efforts to create a series of quantitative stock selection models for his company, Standard & Poor’s, and produce a “road map” of the market from a quantitative point of view.
With this practical guide, you will gain an effective instrument that can be used to improve your investment process, whether you invest qualitatively, quantitatively, or seek to combine both. Each alpha-achieving strategy has been extensively back-tested using Standard & Poor’s Compustat Point in Time database and has proven to deliver alpha over the long term. Quantitative Strategies for Achieving Alpha presents a wide variety of individual and combined investment strategies that consistently predict above-market returns. The result is a comprehensive investment mosaic that illustrates clearly those qualities and characteristics that make an investment attractive or unattractive. This valuable work contains:
- A wide variety of investment strategies built around the seven basics that drive future stock market returns: profitability, valuation, cash flow generation, growth, capital allocation, price momentum, and red flags (risk)
- A building-block approach to quantitative analysis based on 42single-factor and nearly 70 two- and three-factor backtests, whichshow the investor how to effectively combine individual factors into robust investment screens and models
- More than 20 proven investment screens for generating winning investment ideas
- Suggestions for using quantitative strategies to manage risk and for structuring your own quantitative portfolios
- Advice on using quantitative principles to do qualitative investment research, including sample spreadsheets
This powerful, data intensive book will help you clearly see what empirically drives the market, while providing the tools to make more profitable investment decisions based on that knowledge–through both bull and bear markets.
Editorial Reviews
About the Author
Excerpt. © Reprinted by permission. All rights reserved.
QUANTITATIVE STRATEGIES FOR ACHIEVING ALPHA
By Richard Tortoriello
The McGraw-Hill Companies, Inc.
Copyright © 2009 Richard Tortoriello
All right reserved.
ISBN: 978-0-07-154984-4
Contents
Chapter One
Introduction: In Search of Alpha
I do not know what I may appear to the world; but to myself I seem to have been like a boy playing on the sea-shore, and diverting myself now and then finding a smoother pebble or a prettier shell than ordinary, whilst the great ocean of truth lay all undiscovered before me.
Sir Isaac Newton
Don Quixote: Dost thou see? A monstrous giant of infamous repute whom I intend to encounter.
Sancho Panza: It’s a windmill.
Don Quixote: A giant! Canst thou not see the four great arms whirling at his back?
Sancho Panza: A giant?
Don Quixote: Exactly!
From Man of La Mancha, Dale Wasserman, Miguel de Cervantes
I’ve read with interest the journals of Meriwether Lewis and William Clark as they undertook, at the request of Thomas Jefferson, to explore the unknown western frontier and to find a route to the Pacific. These journeys contained as many dangers as they held wonders (and were financed by Congress for $2,500the dollar went further back then). Their expedition, which did much to open the West to further exploration and settlement, became known as the Corps of Discovery. Although the greatest dangers faced by the author of this work were perhaps fatigue and eye straina far cry from grizzly bear, white-water rapids, and belligerent nativesthe same spirit of discovery motivated the undertaking of the tests and explorations that form the basis of this book.
Unlike the western United States in the early 1800s, the frontiers of finance have been well charted. Many of the investment field’s greatest minds have put their ideas and methods, earned through years of hard work and experience, down on paper for anyone with a few dollars or a library card to explore. The student of common stock investing can find hundreds of books covering almost every imaginable topic, from valuation analysis, to risk arbitrage, to day trading. With such a vast literature, developed by thousands of market participants over many decades, one might ask What is there left to discover?
One answer, I believe, is that, while investment theory has been mapped out well qualitativelybased on the experiences and insights of market participantsit has yet to be mapped out comprehensively from an empirical point of view. The reason for the wealth of qualitative literature and dearth of quantitative (outside of the university) is quite simply that investing is more art than science. Some of the best investment strategies are too dependent on the capabilities of the human mind to be reduced to a few lines of computer code. However, the advent of the personal computer and the database has provided a wonderful tool with which many investment strategies can be effectively modeled and tested. Numerous individual quantitative studies have been published, particularly in academia. Most, however, have been specialized, and some have been of questionable practical value. Quantitative professionals, on the other hand, have primarily written technical volumes (how-to guides for quantitative analysis), when they have written anything at all.
My quest began with two primary goals: to create a series of quantitative stock selection models for the Standard & Poor’s Equity Research department and to provide myself and others with a “map” of the market from a quantitative point of view. This book presents investors with this map, as far as I have been able to draw it. Specifically, the work seeks to determine empirically the major fundamental and market-based drivers of future stock market returns. To arrive at this empirically drawn investment map, we tested well over 1,200 investment strategies: some worked well, and others didn’t. Some of the strategies presented here are well known and widely employed; others are less well known and much less used outside of the world of professional money management. However, all of the factors presented in this book work, from a quantitative standpoint.
A true quantitative investor uses sophisticated mathematical models to gain an edge, sometimes ever so slight, over the market. This edge is then magnified with lots of money and lots of leverage (borrowed money). This book is not written for the “quant.” Indeed, I am not qualified to write such a book. Readers need neither a Ph.D. in math nor an advanced knowledge of statistics to understand any of the tests contained herein. What readers do need is some interest in quantitative analysis and a desire to understand the basic drivers of stock market returns. This book was written with qualitative investors in mind, particularly those who wish to “understand” the stock market from a quantitative (empirical) point of view and who desire to integrate quantitative screens, tests, or models into their investment processor simply into their thinking. Such integration is where art meets science. My personal belief is that the quantitative approaches outlined in this book can provide a proven way to generate investment ideas for the qualitative investor as well as a discipline that can help improve investment results.
QUANTITATIVE VERSUS QUALITATIVE ANALYSIS
Perhaps a couple definitions are in order here. Quantitative analysis differs from qualitative analysis in a variety of ways. In qualitative analysis, the investor typically focuses on a small number of individual companies and conducts research on each to determine its business strengths and weaknesses, its market opportunities and competitive position, the capabilities of management, and the comparative value offered by its stock relative to other stocks available for purchase. Qualitative investors often use a company’s historical record (income statement, balance sheet, cash flow statement, etc.) as a jumping off point to project future trends in earnings and cash flows. The focus in qualitative analysis, as in the stock market itself, is on the future. Analytical techniques are tailored to the company and industry in question, and the investor seeks to make large gains in individual stocks. In short, qualitative analysis favors depth over breadth and the art of investment over a more “scientific” approach.
Quantitative analysis, on the other hand, seeks to discover overall tendencies or trends in the investment markets, particularly those that are predictive of future “excess” returns. To identify these trends, the quantitative analyst examines large numbers of companies over long periods of time. Analysis is by necessity standardized and depends entirely on the historical record: income statement, balance sheet, cash flow statement, and market- based data. That is, unlike most qualitative research, quantitative tests primarily look backward. Quantitative analysis emphasizes breadth over depth and science (testing and observation) over art. The quantitative analyst may apply the art of investment analysis in devising investment models and backtests, but once the models are determined, they’re often purely mechanical in their operation. In sum, quantitative analysis relies primarily on computer-assisted inquiry, while qualitative analysis relies primarily on the workings of the human mind.
Although there are many similarities between the computer and the human mind, there are also vast differences. Of the two, only the human being can stake any real claim to intelligence. The mind has the ability to digest and synthesize a diversity of information (e.g., investors must consider everything from the industry, economic, and political climate to the individual products of a company and the demand for its shares in the stock market), an ability that even the most advanced computer can’t come close to matching. By carefully weighing a variety of factors, the human being can make projections about events that have some probability of occurring in the future.
Computers, on the other hand, are in essence sophisticated adding machines: they “act” only according to instructions given them from the outside. It’s taken decades to develop a computer capable of beating a champion at a chess game, and here the variables are limited to the moves available to 32 pieces on a 64-square board. So, in a field such as investing, where returns may be affected by almost any type of activity, human or natural, the computer seems to be disadvantaged.
However, the computer has two distinct advantages that the human being does not. It can process large amounts of data very quickly (e.g., the way that IBM’s “Deep Blue” supercomputer beat chess champion Garry Kasparov), and it lacks emotion. Both points are important, but the second especially so. Consider the following scenario (one that occurs frequently in real life): You’ve bought $10,000 worth of Apple Computer common stock, which has advanced 20% since your purchase. Sales of iPods are going strong, and positive stories on Apple are in the press almost every day. You’re feeling exuberant and thinking of purchasing more, despite a rather high market valuation for the shares. Before you do so, however, Apple announces that it has seen a “mix shift,” in which unit volumes of iPods have decreased (i.e., it has shipped fewer iPods), but revenues and earnings growth have remained about the same because it is now shipping more high-end units than low-end ones. Over a period of a couple months following this news, the stock drops 22%, and your original shares are now selling well below their purchase priceyou are now losing money, and euphoria (most likely) has given way to anxiety.
However, Apple’s stock market valuation now looks much more reasonable, its business is doing well, and the untapped market for iPods seems large. Do you (1) sell your original shares, (2) hold your shares but buy no more, or (3) hold your original shares and buy more? On paper, this may all seem simple. If the business is doing well and its valuation looks attractive, buy more. But try to imagine yourself in this situation: You are now sitting on a $640 paper loss that used to be a $2,000 profit. News articles are appearing frequently, speculating on why Apple shares have declined, and you’re wondering if there is some bad news on the horizon that hasn’t yet been released.
Under these circumstances many investors would sell. They sell not because there is a good reason, but because they are losing money, and emotions have the upper hand. Multiply the one investor in our example by thousands, and you’ll understand why the psychological factor has such a strong influence on stock prices. In fact, the psychological factor in the stock market often creates opportunity, and it is here that our computer might come in handy.
The academic finance profession has struggled for decades to develop an “efficient market hypothesis” that works in practice. The EMH holds that financial markets quickly discount all available information, and thus that outperforming “the market” over any stretch of time simply isn’t possible (or that such a stretch is just plain luck). Many professional investors, with long track records of consistently generating above-market returns, have proven that the EMH doesn’t reflect the whole financial truth. The stock market is often efficient in rationally evaluating available information, but at other times its “judgment” becomes impaired by the psychological factors mentioned above. In other words, the market is also often inefficient. A quantitative example might illustrate the point. Over the 20 years from 1987 through 2006 (the period over which most of the backtests in this book were conducted), the average annual difference between the 52-week highs and 52-week lows of stocks in our Backtest Universe (about 2,000 of the largest publicly traded stocks) was 32%. Over the same period this same group of companies recorded compound annual growth in net income of just 9%. With income growing at an average rate of 9%, there is no reason that stock prices should jump up and down by 32% each year, yet they do. Where money is concerned, emotion regularly overcomes rationality, and stocks go up and down for no other reasons than fear, greed, hope, or despair.
The quantitative tests presented in this book seek to uncover investment strategies that consistently outperform the market, based only on historical data. The strategies assume neither an efficient market nor an inefficient market. Rather, they exploit the two previously mentioned advantages of the computerits lack of emotion and its ability to process large amounts of datato determine which investment strategies hold the most promise for the investor. With a single inexpensive computer, an investor can now examine thousands of companies and hundreds of data items over several years in a matter of minutes or hours. In addition, the investor can model with the computer a strategy that applies perfect discipline. The model determines the strategy, and the computer follows the discipline of that strategy until instructed to do otherwise.
The strategies presented in this book are deliberately tested in a crude fashion. We do not divide our backtests into deciles, or take only the top so many and bottom so many companies, because we simply want to know if the strategy works. (Our criteria for a strategy that works are (1) the top quintile outperforms the market by a significant margin; (2) the bottom quintile significantly underperforms; (3) outperformance and/or underperformance have been consistent over the years; and (4) there is some linearity in the performance of the quintiles, indicating a strong relationship between the strategy and excess returns.) I call this a shotgun or buckshot approach to investment-strategy testing. If a strategy passes the shotgun testif it hits the target more than it misseswe say that it works. It won’t work for every stock selected by the strategy, and it won’t work every year, but overall, the strategy can be said to have investment value.
I call strategies that have investment value building blocks. All of the strategies presented in this book have investment value for a particular reason; that is, we can explain why it is that stocks in the top quintile outperform and stocks in the bottom quintile underperform. When we understand why a strategy works, it becomes a building block that can be combined with other strategies to form an even stronger investment model. Some strategies work for similar reasons (e.g., they each have to do with profitability or with valuation). Others are complementary (one has to do with growth, and the other has to do with value). Thus, knowing why a strategy works helps one to combine it effectively with other strategies. Building blocks are determined only through testing (empiricism), and are verified through a sort of triangulation the strategy must work in a variety of ways under a variety of circumstances.
Another concept key to the understanding of this book is the idea of a mosaic. A mosaic is a picture or pattern made by putting together many small colored tiles. In a real mosaic, each tile is meaningless when viewed alone, but when put together by an artist, a beautiful pattern emerges. In our mosaic, each tile is an investment strategy that has investment value (consistently outperforms or underperforms the market) and is understood by the reader (we know why it works). By understanding the drivers behind these strategies, we begin to comprehend certain characteristics of companies and stocks that aid investment returns. When all the investment strategies presented in this book are put together, a mosaic emerges that shows us quite clearly “what drives the market” from a quantitative point of view, and what characteristics to look for or to avoid in the companies and stocks in which we plan to invest.
The quantitative strategies presented here can certainly be improved upon and refined. However, one should always bear in mind that quantitative analysis by itself is a mechanical approach to investing. It is not a science, in the strict sense of the word, but it is also not the more pure art practiced by great investors like Warren Buffett, John Templeton, Julian Robertson, Jim Rogers, John Neff, Ken Heebner, and a host of others. After reading that John Neff’s favored approach to valuation was the “total return ratio,” which he defines as projected earnings per share (EPS) growth plus dividend yield divided by the price/earnings (P/E) ratio, I was slightly surprised to find that the strategy did not test well quantitatively. The reason, I realized, is that Neff brought a high degree of art to his investment process. Joe Smith, off the street, using the same simple approach would probably record lackluster results at best.
TOWARD AN INTEGRATED MODEL OF INVESTMENT ANALYSIS
Although qualitative and quantitative analyses form separate disciplines, they also complement and reinforce each other. My hope is that this book will help bridge the divide that exists among fundamental (qualitative) analysts, market technicians, and quantitative analysts alike. During my career as an equity analyst, it has become obvious to me that investors involved in different investing disciplines often segregate themselves accordingly. Fundamental analysts often affect disdain for “chartists” (although I’ve never known a fundamental analyst who when analyzing a stock didn’t first look at its chart, and in times of trouble many can be seen quietly consulting the neighborhood technician). Technical analysts, on the other hand, sometimes make it a point of pride to know nothing about a stock other than its ticker symbol and price action. (Attending a conference for technical analysts, I was once asked what I did for a living. My response, “I’m a fundamental equity analyst”; the parry, “I’m sorry to hear that.”) And quantitative analysts are literally segregated from their qualitative and technical peers, often working with little contact with either. (I am encouraged by the fact that there seems to be a movement to more closely integrate qualitative and quantitative analystsa recent conference in New York on this subject was well attended by major investment houses, even if the motive of the attendees might have been simply to use quantitative analysis to improve risk management.)
(Continues…)
Excerpted from QUANTITATIVE STRATEGIES FOR ACHIEVING ALPHAby Richard Tortoriello Copyright © 2009 by Richard Tortoriello. Excerpted by permission of The McGraw-Hill Companies, Inc.. All rights reserved. No part of this excerpt may be reproduced or reprinted without permission in writing from the publisher.
Excerpts are provided by Dial-A-Book Inc. solely for the personal use of visitors to this web site.
{“@context”:”https://schema.org”,”@type”:”Book”,”name”:”Quantitative Strategies for Achieving Alpha: The Standard and Poor’s Approach to Testing Your Investment Choices”,”image”:”https://m.media-amazon.com/images/I/41NOdWdFSvL._SY445_SX342_ML2_.jpg”,”author”:{“@type”:”Person”,”name”:”Richard Tortoriello (Author)”},”publisher”:{“@type”:”Organization”,”name”:”McGraw-Hill Education”},”datePublished”:”16 Nov. 2008″,”isbn”:”9780071549844″,”numberOfPages”:480,”inLanguage”:”English”,”description”:”Alpha, higher-than-expected returns generated by an investment strategy, is the holy grail of the investment world. Achieve alpha, and you’ve beaten the market on a risk-adjusted basis. Quantitative Strategies for Achieving Alpha was borne from equity analyst Richard Tortoriello’s efforts to create a series of quantitative stock selection models for his company, Standard & Poor’s, and produce a “road map” of the market from a quantitative point of view.With this practical guide, you will gain an effective instrument that can be used to improve your investment process, whether you invest qualitatively, quantitatively, or seek to combine both. Each alpha-achieving strategy has been extensively back-tested using Standard & Poor’s Compustat Point in Time database and has proven to deliver alpha over the long term. Quantitative Strategies for Achieving Alpha presents a wide variety of individual and combined investment strategies that consistently predict above-market returns. The result is a comprehensive investment mosaic that illustrates clearly those qualities and characteristics that make an investment attractive or unattractive. This valuable work contains:A wide variety of investment strategies built around the seven basics that drive future stock market returns: profitability, valuation, cash flow generation, growth, capital allocation, price momentum, and red flags (risk)A building-block approach to quantitative analysis based on 42single-factor and nearly 70 two- and three-factor backtests, whichshow the investor how to effectively combine individual factors into robust investment screens and modelsMore than 20 proven investment screens for generating winning investment ideas Suggestions for using quantitative strategies to manage risk and for structuring your own quantitative portfoliosAdvice on using quantitative principles to do qualitative investment research, including sample spreadsheetsThis powerful, data intensive book will help you clearly see what empirically drives the market, while providing the tools to make more profitable investment decisions based on that knowledge–through both bull and bear markets.”,”bookEdition”:”Illustrated”,”url”:”https://www.amazon.co.uk/dp/0071549846/”,”bookFormat”:”http://schema.org/EBook”,”additionalType”:”http://schema.org/PDF”,”fileSize”:”46 MB”,”accessibilityFeature”:[“login required”,”member access only”],”accessibilitySummary”:”PDF version available to authenticated members only. File size: 46 MB.”}


