 Wow! eBook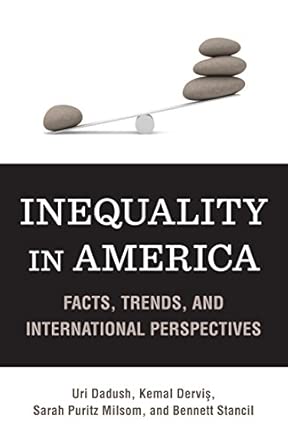
Inequality in America: Facts, Trends, and International Perspectives
Author(s): Uri Dadush (Author)
- Publisher: Brookings Institution Press
- Publication Date: 13 July 2012
- Language: English
- Print length: 105 pages
- ISBN-10: 0815724217
- ISBN-13: 9780815724216
Book Description
Editorial Reviews
Review
About the Author
Excerpt. © Reprinted by permission. All rights reserved.
INEQUALITY IN AMERICA
Facts, Trends, and International PerspectivesBy Uri Dadush Kemal Dervis Sarah Puritz Milsom Bennett Stancil
BROOKINGS INSTITUTION PRESS
Copyright © 2012 Brookings Institution
All right reserved.
ISBN: 978-0-8157-2421-6
Contents
Acknowledgments……………………………………………………………vii1 Introduction: The Challenge of Inequality…………………………………..12 The Increase of Inequality in the United States……………………………..43 Three Other Worrying Trends Associated with Rising Inequality…………………254 The Causes of Rising Inequality……………………………………………395 Policy, Politics, and Inequality…………………………………………..626 What Can Be Done?………………………………………………………..737 Conclusion: Narrowing the Gap……………………………………………..78References………………………………………………………………..81Index…………………………………………………………………….89
Chapter One
INTRODUCTION: THE CHALLENGE OF INEQUALITY
A bedrock American principle is the idea that all individuals should have the opportunity to succeed on the basis of their own effort, skill, and ingenuity.
—Federal Reserve Chairman Ben Bernanke
Income inequality has increased dramatically in the United States since the late 1970s. The great economic and financial crisis that hit in 2008 and the persistent high unemployment that has come with it have drawn greater attention to the trend toward marked concentration of income at the top, little or no progress for the middle, and precariousness at the bottom of the income distribution. The problem is now squarely at the center of the political debate. Even among those who view inequality neutrally—or even positively—as the way in which markets reward performance, most agree that some of the features that accompany it, such as reduced opportunity and low social mobility, increased prevalence of poverty, and the stagnation of median household income, are undesirable. Those who traditionally are more concerned about high inequality worry that increased concentration of income is also leading to the concentration of political power, which impedes efforts to mitigate inequality and even may promote policies that exacerbate it. Meanwhile, a number of economists have argued recently that the extreme concentration of income at the top may undermine macroeconomic and financial stability by making it harder to sustainably maintain strong aggregate demand or by encouraging excessive borrowing.
Our objective in this review of the challenge of inequality is to assemble in one place a readable overview of the basic facts and the issues that is accessible to both policymakers and a wider public. Our focus is squarely on the United States, but we draw on international experience and comparisons to shed light on the trends and help sketch out some possible remedies. It is also clear to us that it is impossible to separate the purely economic or technological drivers of inequality from the political processes that shape the policies influencing the distribution of income. We hope to present a comprehensive picture, tying the various dimensions of the topic together but without going into technical detail. An informed discussion of policy needs an empirical summary of the facts and of the various available interpretations. That is what we aim to provide.
Whichever of many possible measures one looks at, inequality in the United States has increased very substantially. Certainly this increased inequality seems to be part of a global trend, yet among economically advanced countries the United States is an outlier. Although it is difficult to attribute the rise in inequality to any one specific cause, it is apparent that technological change, international trade, changes in labor-market participation, the increasing role of the financial sector in the economy, the increased size of markets, and a decrease in the degree of progressivity of taxes all play some role and that several of these factors have been especially pronounced in the United States. In addition, the political environment, the loss of power of organized labor, and apparent changes in social norms affecting compensation at the top also seem to contribute to increased inequality. Though detailed policy recommendations lie beyond the scope of this book, we suggest a number of general policy orientations that could help mitigate some of the more damaging consequences of high and rising inequality, approaches that are compatible with promoting an efficient and competitive economy.
Chapter Two
THE INCREASE OF INEQUALITY IN THE UNITED STATES
Measuring income inequality, even in the United States, where good data are available, is complicated. Attempting to compare U.S. trends with those in other countries becomes exceedingly complicated. Precisely defining income is a challenge in and of itself. Income can be measured gross or net of taxes, including or excluding government benefits, and including or excluding realized capital gains (profits made from selling assets). Units of measurement also vary: sometimes households with multiple earners are the taxable unit and other times only individual income earners, regardless of whether or not they share a household. Both official and private sources often provide data on a combination of different income measures, based on different tax units, and these different sources rarely have identical definitions of income. This poses a challenge not only when we compare across different measurements of inequality but also when we look at the same measurement of inequality calculated from different sources (see table 2-1 for a summary of how the major collectors and disseminators of data define and measure income).
There are many ways to look at the distribution of income within the population, but we will focus our attention on three common measurements: the Gini index, the broadest measure of inequality; the comparison of median income versus the nation’s average, or mean, household income; and the share of incomes at the very top and bottom of the distribution relative to the rest of the distribution. These indicators measure inequality at a point in time. We also discuss social mobility: how those born at the low end of the income distribution tend to fare over time compared to those born in the middle or at the top of the distribution. Low social mobility can be a sign that there is inequality of opportunity, implying that the economy’s human capital or talent is not optimally deployed.
Broad Inequality
The most widely used measure of overall inequality is the Gini index, also called the Gini concentration ratio and the Gini coefficient, which is calculated to indicate the relationship between shares of income and shares of the population. Gini values range from zero (perfect equality) to 1 (perfect inequality, hypothetical values that are never reached). The greater the Gini coefficient, the greater is the concentration of income and the more unequal the distribution of income.
A recent Congressional Budget Office (CBO) report on household income inequality found that the U.S. Gini index rose from 0.48 in 1979 to 0.59 in 2007. Evidence of this trend, and its continuation through 2010, is also found in data provided by the U.S. Census Bureau. After hovering around 0.40 throughout the 1970s, the Gini index as reported by the Census Bureau rose from 0.46 in 2007 to 0.47 in 2010. (Note that these measures are smaller than those reported by the CBO, resulting from differences in the definitions of income used to calculate the index; see table 2-1.) Importantly, the CBO data are based on market income—income before taxes and transfers—whereas census data do include some government transfers. Measures that do not include taxes and government transfers overstate inequality in terms of capacity to spend, since government taxes and transfers typically redistribute income downward. Indeed, historically, taxes and transfers have reduced the magnitude of inequality in the United States, though at a decreasing rate over time. These policies have done little, if anything, to slow the increase in inequality: the CBO estimates that in 2007, federal transfers and taxes decreased the Gini coefficient by about 17 percent. By way of comparison, the redistributive effect in 1979 was greater, with a 23 percent reduction in the Gini. Thus, although taxes and transfers have a redistributive effect, the extent of redistribution has weakened over time, implying that over the last three decades changes in government policies have worked in the same direction as market forces, toward greater inequality. The U.S. Gini index for disposable income (income after federal transfers and taxes), as calculated by the CBO, has continued to rise, going from 0.37 to 0.49 between 1979 and 2007.
Rising inequality is by no means unique to the United States. Seventeen of the twenty-two OECD (Organization for Economic Cooperation and Development) countries for which data are available have seen inequality rise from the mid-1980s to the late 2000s, as measured by the household Gini coefficient. In fact, only two of these countries, Turkey and Greece, have seen a decline in their Gini coefficients (see figure 2-1).
Nevertheless, among developed countries the United States stands out. Relative to the countries examined by the OECD, the U.S. Gini index in the mid-1980s was second highest, behind Mexico, and this remained true through the mid-2000s. Mexico is classified as a developing country by the World Bank, which found income distribution in developing countries be more unequal than in advanced countries, so the statistical proximity of the United States to Mexico is startling, to say the least.
The Man in the Street
The nation’s average income is not an accurate portrayal of the typical household. This is because the income distribution is not symmetrical: there are many more people who earn lower incomes than rich people who earn high incomes. The median income gives a better picture of the true typical household income in the United States; it is the income level at which half of all households earn more and half of all households earn less. The CBO calculates that the average, or mean, market income in 2007 was $64,500, whereas the median income was much lower, $41,700. The real median household income after taxes and transfers (adjusted for inflation) increased by 35 percent between 1979 and 2007, whereas the average household income saw a 62 percent increase in those years. This growing gap between the average and median incomes indicates a pattern in which income growth was heavily weighted toward households with income well above the median income levels (see figure 2-2).
Looking at the median and mean household income before federal transfers and taxes—which are redistributive effects, albeit less so—shows, as expected, an even wider gap (see figure 2-2): the average real household market income grew by 58 percent between 1979 and 2007, whereas the median real household income increased by a meager 19 percent over almost forty years. This reflects the fact that household market incomes have become more concentrated, and at an increasing rate.
Crucially, the figure also shows that the median household saw a decline in real income during the early 2000s and there has been little growth over the whole last decade. Alan Krueger, the chairman of the White House Council of Economic Advisers, recently estimated that if, in the early 2000s, real median household market income had grown at the same rate as it did in the 1990s, middle-class households would have about $8,900 more to spend per year than they currently do.
The Gini coefficient, the mean household income, and the median household income are useful measures for showing an overall trend in the income distribution, and they show that it is undeniably becoming more concentrated. However, these measurements are somewhat insensitive to changes within portions of the income distribution. For example, a relatively small absolute decline in the incomes of those at the lower end of the income distribution may have a big impact on their living standards but will only be reflected in a small change in the Gini. It is useful, therefore, to look more directly at how particular shares of income within the distribution have behaved.
Income at the Extremes
The ratios of top-quintile incomes to bottom-quintile incomes reveal that overall inequality not only has increased in the United States but also has become particularly pronounced at the extremes. The growing gulf between the rich and the poor is the result of remarkable gains at the very top of the income distribution and little advance at the bottom. Within the top quintile—the top 20 percent of earners—the income of the top 1 percent of earners has soared. The CBO finds that market income share of the top 1 percent of households doubled, from around 10 percent of the total market income in the 1970s to more than 20 percent in 2012. Meanwhile, incomes of the 80th-through 99th-percentile households remaining in the top quintile saw their share of income fall. This explosion at the very top has had a strong effect on both the level and growth of overall income inequality, particularly since 1980. According to CBO estimates, from 1979 to 2007, excluding the top 1 percent would have resulted in a 13.8 percent increase in market income inequality as measured by the Gini coefficient, compared to the actual overall increase of 23.2 percent.
Historical studies estimate that this degree of income concentration has not been seen since the days before the Great Depression. According to the World Top Incomes Database, which is created using income tax records for twenty-two countries, the top 1 percent of U.S. tax filers, individuals or couples filing one return, earned 20 percent of U.S. market income in 2010. This share was down from 23.5 percent in 2007, reflecting the losses from the financial crisis, but was still a share not seen since 1928. The top 0.01 percent of tax units—about 15,000 units of over 150 million—earned 5 percent of the total income. Before the financial crisis this group’s share exceeded 6 percent, the highest on record. If the income distribution were perfectly equal, the income of these 15,000 tax units would have equaled that of over 9 million tax units.
The ratios discussed thus far include income from realized capital gains, which is the most unequally distributed source of income (see the later section, “Income Channels and Inequality”). Even excluding capital gains, however, the World Top Incomes Database shows that the current level of income concentration at the top has not been reached since 1929 (see figure 2-4).
This rapid growth of incomes at the top is in contrast with little or negative growth at the bottom of the distribution. The Census Bureau estimates that from 1979 to 2010, the real household income of the bottom 10 percent grew by only 3.6 percent over three decades—a negligible amount. Though these details vary from study to study, depending on how income and tax units are defined, the conclusion is inescapable: income growth at the bottom of the distribution has been slow and has been far outpaced by that at the top.
International comparisons confirm that these phenomena have been particularly pronounced in the United States. Of all countries in the World Top Incomes Database, the United States is home to the highest income shares for the top 1, top 0.1 and top 0.01 percent of earners. Only South Africa and Argentina, two developing countries marked by long histories of deep inequality and social divisions, even come close to the U.S. figures.
Among major developed countries, the United States stands out in another respect: over the four decades since 1970, the extraordinary fact is that there has been almost no increase in average incomes among the bottom 90 percent of earners. From 1970 to 2007 (that is, pre-crisis), average real incomes, excluding capital gains, only increased by about 5 percent, yet for the years 1970 through 2010 (post-crisis), the average actually decreased by 6 percent. By contrast, in Australia, Canada, France, Italy, New Zealand, Norway, and Sweden, the average income of the bottom 90 percent of earners grew on average by more than 60 percent over roughly the same period (see figure 2-5). Note that this figure seems to contradict the very slow but positive growth of median incomes reported by the CBO. There are several plausible explanations for this discrepancy. As can be seen in table 2-1, the definitions of income vary by source. It is important to reiterate that the World Top Incomes Database reports data by tax unit, not by household. A single tax unit includes couples filing jointly, with dependents, or individuals filing separately, with dependents. For this reason data collected by tax unit should not be expected to match data collected by household, as is the case for data collected by the CBO and OECD and for many census studies.
Unsurprisingly, the slow growth at the bottom and rapid growth at the top have polarized the extremes of the income distribution more in the United States than in any other advanced country. Despite some holes in the data, it can be confidently asserted that the U.S. ratios of top-quintile and top-decile incomes to bottom-quintile and bottom-decile incomes are the highest in the OECD. That is, the ratio of the top 20 percent to the bottom 20 percent is higher in the U.S. than in any other OECD country. The same is true for the top 10 percent and the bottom 10 percent. All measures of income inequality in the United States point to the same conclusion: inequality is rising and reaching levels not seen since before the Great Depression of the 1930s, and it is the very large concentrations at the top of the income distribution that are driving this increase. The income gap between the top and the rest began to widen at the beginning of the late 1970s, and this trend has continued, after a brief pause following the 2008 financial crisis. Data for 2011 and 2012 are not yet available, but we guess that the figures will show that inequality in 2011 and 2012, measured by the various definitions used here, will have increased again and will be close to or higher than the level it had reached in 2007. This is because capital and business income and income derived from capital gains will have risen, while real wages will hardly have increased and in many cases will have decreased. About two decades ago, the country’s very highest earners began to dramatically outpace the rest in the rate of their income advances. Many other developed countries have seen the income distribution become more unequal, but the divergence in the United States has been the most dramatic, especially in the extent to which the divergence stems from the concentration of income at the top.
(Continues…)
Excerpted from INEQUALITY IN AMERICAby Uri Dadush Kemal Dervis Sarah Puritz Milsom Bennett Stancil Copyright © 2012 by Brookings Institution. Excerpted by permission of BROOKINGS INSTITUTION PRESS. All rights reserved. No part of this excerpt may be reproduced or reprinted without permission in writing from the publisher.
Excerpts are provided by Dial-A-Book Inc. solely for the personal use of visitors to this web site.


