Wow! eBook
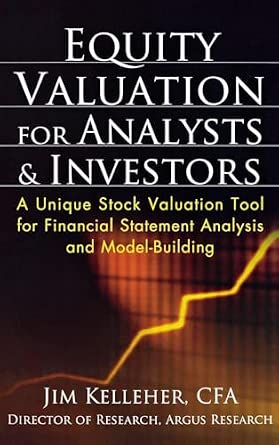
Equity Valuation for Analysts and Investors: A Unique Stock Valuation Tool for Financial Statement Analysis and Model-Building
Author(s): KELLEHER (Author)
- Publisher: McGraw Hill
- Publication Date: 16 Jun. 2010
- Edition: Illustrated
- Language: English
- Print length: 399 pages
- ISBN-10: 0071639233
- ISBN-13: 9780071639231
Book Description
"This amazingly thorough book takes you through real-world financial modeling, provides concise techniques and methods for determining asset value, and offers a blended valuation approach that is responsive to changes inmarket dynamics. Peer Derived Value, introduced in the book, represents an original and commonsense approach to valuing a stock within its peer group. This book, in my view, is an invaluable addition to any investor'slibrary." -- William V. Campbell, Chairman, Intuit Corporation
Equity Valuation for Analysts and Investors introduces you to the financial statement analysis and model-building methodology used by leading equity research firm Argus Research. Written by Jim Kelleher, the company's director of research, the book offers thetools for estimating individual equity cash value. These include a completely original and proprietary valuation methodology, Peer Derived Value, which values an equity based on the stock's current variation from its historical relation to a user-specifi ed peer group.
In a conveniently organized format, this in-depth guide covers all the tasks you need to master, including:
• Financial statement modeling • Comparables analysis• Discounted free cash fl ow • Industry matrix models• Blending valuation inputs to calculate fair value in any market environment
Valuing and predicting the future value of assets and stocks is a laborious task. Successful analysts andinvestors don't have time for tedious work that is outdated as soon as it's done.
Equity Valuation for Analysts and Investors isthe comprehensive guide to efficient financialstatement analysis and model-building from one of the world-leading independent equity research firms, Argus Research.
At the helm of the company's research is author Jim Kelleher, who developed his methodology and model-building techniques during his twenty years covering more thana dozen industries in nearly every sector. A good valuation model is an invaluable tool to help the serious investor:
- Wring more information from the 10-K and 10-Q
- Predict unexpected earnings shortfall or positive earnings surprises
- Master the art of "valuation choreography"
One of the biggest challenges to making accurate predictions with a valuation model today is the rapid and constant fluctuation of data. Equity Valuation for Analysts and Investors provides a tried-and-true process for creating effective, compact models that add newmeasurement and valuation periods and accommodate a company’s unique data presentation and reporting style.
This versatile guidebook also provides both a rigorous process and a shortcut for each step in modeling financial statement data so analysts can customize their data focus based on their position in the value chain. When implemented in the real world, the valuation model uses thepower of Excel to allow investors to quickly and accurately update their valuations and predictions by simply inputting adjusted data.
Take control of your investments now by managing them based on your own research and Equity Valuation for Analysts and Investors.
Editorial Reviews
Review
About the Author
Excerpt. © Reprinted by permission. All rights reserved.
Equity Valuation for Analysts & Investors
A Unique Stock Valuation Tool for Financial Statement Analysis and Model-Building
By JIM KELLEHER
The McGraw-Hill Companies, Inc.
Copyright © 2010 The McGraw-Hill Companies, Inc.
All rights reserved.
ISBN: 978-0-07-163923-1
Contents
AcknowledgmentsIntroductionPART 1 INCOME STATEMENT PRESENTATIONChapter 1 Phase 1: Income Statement and Margin Model, Part 1Chapter 2 Phase 1: Income Statement and Margin Model, Part 2Chapter 3 Phase 2: Segment Modeling of RevenuesChapter 4 Phase 3: Segment Operating Income and Percentage-of-Difference
ModelingChapter 5 Phase 4: The Workbench, Part 1Chapter 6 Phase 4: The Workbench, Part 2Chapter 7 Ordinary Least Squares Regressions and Normalized EarningsPART 2 RATIO AND VALUATION WORKSHEETChapter 8 Ratio Analysis, Part 1: Internal Liquidity and Operating
EfficiencyChapter 9 Ratio Analysis, Part 2: Return Ratios and Cash Flow RatiosChapter 10 Historical Comparable ValuationPART 3 STOCK VALUE WORKSHEETChapter 11 Present Value Modeling and the Stock Value WorksheetChapter 12 Discounted Free Cash Flow: Setting the TableChapter 13 Discounted Free Cash Flows: Two MethodsPART 4 RELATIONAL VALUATION: THE INDUSTRY MATRIX WORKBOOK AND PEER DERIVED
VALUEChapter 14 Price and Performance AnalysisChapter 15 Simple Average and Market-Weighted ComparisonsChapter 16 Peer Derived ValueConclusion: Dollar Value of the AssetBibliographyIndex
Excerpt
<h2>CHAPTER 1</h2><p><b>PHASE 1: INCOME STATEMENT AND MARGIN MODEL, PART 1</p><br><p>Modeling in a Workbook</b></p><p>Modeling requires populating countless cells on a spreadsheet. Some of thosecells hold complex formula; others hold numbers. As you build your model, you'llknow which is which; but to the uninformed eye, a formula cell and a number cellare indistinguishable.</p><p>One difficulty with describing a dynamic process in a static medium such as abook is that our spreadsheet examples (designated as <b>Figure 1.1, Figure1.2</b>, etc.) cannot fully display the formulas residing within; that wouldmake for indecipherable gibberish. We thus ask that you read the text closely,refer carefully to the model when requested, and make the needed abstractconnections between written word and illustration on the page.</p><p>We are going to conduct our analysis of a single equity, as much as possible, ona single workbook with linked worksheets. Later we'll discuss a matrix workbookin which we aggregate data from the individual workbooks. Later still we'llthrow data from the matrix workbook back to the individual worksheet to providea kind of peer group relative ranking that will help inform the valuationcalculation. For now, though, we can begin with a focus on the individual equityworkbook.</p><p>Our goal is to build a workbook that, once created, can be replicated for othercompanies in the coverage universe with the least amount of disruption. We'llspend a great deal of time discussing communications equipment companies, solet's borrow a metaphor from the industry to describe a key element of our task.In an astounding transformation, the legacy communications infrastructure hasbeen torn down and replaced with protocols such as Ethernet borrowed from thedata network. Ethernet was chosen partly because it is ubiquitous (there is onlyone Ethernet jack in use the world over) but mainly because it is easilyreplicable.</p><p>When we build a workbook, we'll have a few tasks in mind. We want the individualequity workbook to fully capture value for a single stock. But we also want itto lend itself to relatively straightforward manipulation whereby it cantransformed into a second company model, and a third, and so forth.</p><p>No two companies are alike; equally important, no two companies report theirfinancial data in exactly the same way. Creating a replicable workbook is a keyelement of our task, given that we are working in a world of jangling phones anddeadlines, and we certainly are not within that proverbial ivorytower—which, as metaphors go, must be at least as politically insensitiveas skinning cats.</p><p>Our individual company workbook will have several worksheets. At a minimum, ourgeneric workbook will include income statement (or income statementpresentation, as we'll call it); ratios and valuations, where we'll conducthistorical comparable valuation and also aggregate annual ratios and annualfinancial statements; a present value worksheet for discounted free cash flowvaluation; a query page for real-time pricing; and a worksheet to calculate"smoothed" historical growth rate and forecast normalized earnings. In practice,any workbook used to model and value an individual equity will over time sproutadditional worksheets that will be used to track changes in manufacturingfootprint, model the combination of acquired assets, or accommodate other real-worldevents.</p><p>We'll discuss formatting of individual worksheets and necessary historicalbackup data as we go. For the past two years, we have been modeling in .xlsxworkbooks. All our techniques work in prior-generation .xls workbooks as well.If you are new to this process, we highly recommend that you begin with the.xlsx workbooks consistent with the latest version of Excel.</p><p>Given that we need to create a replicable workbook, choose for your first modelthe most "normal" company in coverage. In other words, for your template use acompany with steady and even boring growth, consistent profitability, little tono history of changing segment presentations, and a reasonably stable businessmodel. If no such company exists in your coverage, take the best of the bunch.</p><p>Every workbook needs to access a source for real-time pricing of the asset. As afirst step, we will label worksheet 1 as our "Query" page. Our recommendedprice-data source, and the one used in all our workbooks, is the Money page fromMSN. Guidelines for linking data to this worksheet will vary; the processtypically requires that a ticker be placed on the query worksheet for immediatereference, or on an adjacent worksheet for a linked reference. In addition tothe ticker for the individual equity, we will need real-time pricing for themarket beenchmark—in this case, the Standard & Poor's 500 Index (S&P 500).Given that the pricing function can accommodate dozens of tickers, it is alsohighly useful to includddde prices for the other major indexes [Dow JonesIndustrial Average (DJIA), Nasdaq, and New York Stock Exchange Composite (NYSEComposite)]; you may also want to include industry indexes in which the equityis a member.</p><p><b>Figure 1.1</b> shows the Query worksheet in the Motorola (MOT) model. Inaddition to prices for MOT, we have priced the S&P 500; much further down theline, this will come in handy for calculating the relative P/E. Also note whatis not there; at this point, we have no need to price the peer group.</p><br><p><b>Tracking Down Historical Data Sources</b></p><p>Having built several hundred income statement models, I can tell you thatindividual company income statement presentations are like snowflakes orfingerprints: remarkably similar, but if you squint, you can see thedifferences. Individual income statements aren't issued by cookie cutters; theycome from the finance departments of disparate companies, peopled withindividuals with their own quirks.</p><p>The modeled income statement has at its heart a variety of percentage-of-revenueinputs. The trouble is, being married to pure percentage-of-revenue procedurerobs your model of nuance and precision. As we'll demonstrate later on,depending on the data, you can build an income statement model not on percentageof sales but on percentage of <i>difference</i> between forecast revenue andforecast operating income.</p><p>To model future financial statements, you need historical data as issued by thecompany. This historical data will be most usefully recorded in the company'sown filings with the Securities and Exchange Commission (SEC), available onevery company Web site (typically, see Home Page>InvestorRelations>Financials>SEC filings). A variety of pay-for sites exist that enabledownload of data into Excel; they may charge a one-time fee or a subscription.Because these come and go, we'll limit our mentions to EDGAR.</p><p>Prepare for some confusion. EDGAR (electronic data gathering, analysis, andretrieval) is a useful and free service sponsored by the SEC that simplifies thetracking down of SEC filings for every company. News headlines on the Web,however, will frequently steer you to EDGAR Online Pro, which is a pay service.Your particular situation—including the extent of your coverageresponsibilities, your company's resources, and time constraints—willdetermine whether you rely on a vendor for historical data or transcribe thedata the old-fashioned way.</p><p>Public companies in the United States are compelled to report their resultsevery 90 days. They may or may not do so through their investor relationsfunction. Some firms provide all the bells and whistles, including 20-page pressreleases, an accompanying slide deck, conference call, and even conference calltranscript. Sometimes you get no more than a press release with abbreviatedfinancial data. More and more companies have discovered the virtues of beinguser-friendly toward investors. As part of that outreach, many firms now furnishtheir financial statements in Excel format for easy download into your model.</p><p>You will also find that financial data is available on the major financialsites, both free (Yahoo! Finance, Google Finance) and pay (Bloomberg). True, youcan gather financial statements from these and other sources. But be careful;you don't want a cookie-cutter synopsis of all the main points. That istypically what you get on Yahoo! Finance, which uses a cooked-down version ofthe income statement, balance sheet, and cash flow statement.</p><p>For your sanity while maintaining a model over the long term, you'll need tomodel every line, because you need your model to think and act like the issuingCFO. So here is another of our bona fides: we will begin by recreating the modelexactly as the issuing company does. Later we will change it to accommodate thereal world as well as our own organizational needs.</p><p>We recommend beginning with (at least) a base of the five preceding historicalyears, with the immediately preceding two years modeled in historical quarters.Perhaps most important, for all annual periods, we are going to reinvent thepast one or two years not as a series of discrete quarters, but as a process.</p><br><p><b>Amending the Status Quo</b></p><p>To my thinking, the standard business school guidance on income statementmodeling is replete with problems. The standard guidance is something like this:Represent the figures in the income statement as percentages of revenues. Linethe quarters up one next to the other; sum them for the full year. For certainhigh-priority inputs, position year-over-year or quarter-over-quarter percentagechanges immediately below the line item. Situate the percentage of revenuepercentages at the bottom of the sheet for each quarter; link them to theindividual cells below the revenue line. Rinse and repeat for year 2.</p><p>Some form of percentage-of-revenue modeling is a given, and we'll use percentageof revenue as a starting point. But, to my thinking, the importance ofpresentation on the page is overlooked in that standard template. So too isconvenience, a vital need for the time-challenged analyst. For example, Excelmakes for easy summing. The introduction of annual or sequential rate-of-changepercentages in the column thwarts that process or introduces inaccuracy into themodel. Sure, percentages amount to less than 1, but why introduce any inaccuracyin a carefully modeled income statement?</p><p>Here's another early key takeaway: think like the reporting company. Thereporting company sees the year not as four discrete baskets but as a process.Companies are dynamic; they set goals based around new product ramps andextensions, cost management, competitive progress, and host of other things.Therefore, our income statement mirrors the company's presentation and modelsthe year cumulatively. Moreover, the progress or lack thereof should be visuallyimmediate to the modeler. To this end, we include summary columns as the yearprogresses, for the first half, nine months, and full year.</p><br><p><b>Structuring the Income Statement Model</b></p><p>If you are beginning with that standard model of four side-by-side historicalquarters from the preceding year lined up next to one another, adjust them asfollows: Immediately to the right of historical quarter 1 and between quarter 2,add a column enabling visualization of year-over-year percentage change forevery line item. Italicize this column too, further distinguishing it from anycolumn containing dollar values. Next comes historical quarter 2; similarlyposition next to it a column enabling year-over-year percentage change in everyline item.</p><p>Here's where our divergence begins, enabling us to see the year as a process. Inthe next column we sum the half-year to date. Then comes quarter 3 and itsattendant annual percentage change column, followed by a nine-month sum of theyear to date. Finally we position quarter 4 and its attendant percentage changecolumn, with the full-year summary and its annual change column.</p><p>In <b>Figure 1.2</b>, we see the four historical quarters for ADTRAN in 2004. Ido not typically include a year-over-year rate of percentage change comparisoncolumn for the half year or the nine months, because investors don't usuallythink in these terms. But these interim-period columns are available for easycomparisons.</p><p>Modelers may wonder: where are the sequential comparisons? These can matter morethan annual comparisons for some companies, particularly firms with a limitedseasonal influence and those still in their early growth phase. Given proximityon the page, visual rather than percentage change is sufficient for sequentialcomparison for many line items. For higher-priority inputs, we will furnishformal sequential comparisons as needed, mainly further down the incomestatement presentation.</p><br><p><b>A Not-So-Random Walk Down the Income Statement</b></p><p>For thoroughness, let's take a quick walk down the income statement. Purists, beforewarned: the emphasis here is on <i>quick</i>, and what follows is bynecessity a very cursory treatment of complex topics. Much more thoroughtreatments of income statement line items are available elsewhere. Whole volumeshave been devoted to revenue recognition, depreciation, FIFO-LIFO accounting,tax treatment, and other issues; it would be a distraction to detail them here.At least on a summary basis, the model builder must know the basis of individualline item inputs in order to best represent them.</p><p>The first line item on the income statement is revenues. Many companies havetaken to breaking out product from service revenues. We always welcome enhancedgranularity.</p><p>Remember that revenues do not reflect cash that has <i>ca-chinged</i> the cashregister within a 90-day span. Instead, it reflects revenues "recognized" in aperiod. Given the payment terms of 30 to 60 days in the United States and oftenmuch longer overseas, recognized revenues may not jingle the cash register formonths. This tally also includes proportional payments from lump sums collectedearlier (e.g., one-twelfth of a 12-issues-per-year magazine subscription).Service revenues in particular will reflect timed recognition of cash paideither in lump sum or over a period for regularly scheduled maintenance and/orspecial services.</p><p>Cost of goods sold, or COGS, primarily reflects what is recognized (again, asopposed to what is spent) to physically produce goods or, in some cases,services. This mainly includes costs for materials, manufacturing, maintainingthe supply chain, procurement, and most of the costs of keeping the factorygoing. The difference between revenue and COGS is gross profit or gross margin.</p><p>Another element in COGS is depreciation, reflecting assumed loss of value in aphysical asset from usage and time's passage. Formerly, depreciation was lumpedin DDA (depreciation, depletion, and amortization); depletion is mainly ofinterest to energy investors, while companies now prefer to separately listamortization (more below in our continuing operations discussion).</p><p>Throughout this text, when we address financial statement accounting, ourshorthand is "book" accounting; what happens in the real world we refer to as"cash" accounting. On a book basis, assets are depreciated on a straight-linebasis, meaning in equal increments over the asset's useful life. In the realworld, companies use the more tax-friendly accelerated depreciation, where highlevels of depreciation are recognized early on followed by ever-decreasingdecrements. This discrepancy is one of several that influence the differencebetween income statement accounting and real-world accounts.</p><p>COGS will also be influenced by inventory treatment decisions. LIFO accountingis an acronym for "last in, first out," meaning a company records a profit fromsales based on the company's cost for its most recently purchased inventory.Remember that this is not a product-flow issue but an accounting recognitionone. LIFO is regarded as better matching costs to prices. In a period ofnormally increasing prices, or inflation, LIFO reduces profits and thereforetaxes compared with FIFO, which is an acronym for "first in, first out." FIFO isconsidered appropriate when a company ships an undifferentiated product, such asa commodity. Start-ups may favor FIFO; in a period of normally increasingprices, FIFO increases inventory values and makes a company look "bigger." Forthe small company, conveying size can matter in winning new financing. Theprevailing International Financial Recordings Standards, or IFRS, does notaccept LIFO.</p><p>Continuing down the income statement we come to the two or three key elements ofoperating cost. Most often, these are (1) research and development (R&D) and (2)selling, general, and administrative (SG&A); less often, they are (1) R&D, (2)selling and marketing (S&M), and (3) general and administrative (G&A). Fans ofthe granular, we always prefer the second three-part representation, because itbetter breaks out selling and marketing costs from the cost of the corporatefunction.</p><p>These key operating costs are also of interest because embedded within them arestock-compensation costs that some companies, in league with their coveringanalysts, will disaggregate in order to better represent real costs of doingbusiness. FAS 123R is a relatively new standard that compels corporations toreflect components of stock-option compensation within the income statement lineitem in which they are expensed. In other words, if a portion of an engineer'scompensation is in the form of stock, this payout must be included as a costwithin R&D. Prior to this standard, the cost to the company of stock granted tothat engineer would not appear in the R&D line item. FAS 123R has had a profoundimpact on operating costs and thus on net income. Its disruptive appearance incurrent income statements makes a strong argument for staying current onaccounting standards, and on creating a financial model flexible enough toaccommodate them as they occur.</p><p>Other elements of operating costs that frequently earn a regular spot asseparate line item on the income statement include amortization of intangiblesand "other," a deliberately vague catch-bag of items that may include legalsettlements, disposition of minor assets, current exchange effects, or "other."</p><p>In an ideal world, companies would operate flawlessly, every acquisition wouldbe perfectly timed and seamlessly integrated, and the economy would always be inthe up part of the cycle. Back here in the real world, companies overshoot onexpectations and underdeliver on performance, buy ill-fitting assets that gum uptheir core operations, and navigate a macroeconomy in which bumps alternate withpitfalls.</p><p><i>(Continues...)</i>
(Continues...)Excerpted from Equity Valuation for Analysts & Investors by JIM KELLEHER. Copyright © 2010 by The McGraw-Hill Companies, Inc.. Excerpted by permission of The McGraw-Hill Companies, Inc..
All rights reserved. No part of this excerpt may be reproduced or reprinted without permission in writing from the publisher.
Excerpts are provided by Dial-A-Book Inc. solely for the personal use of visitors to this web site.