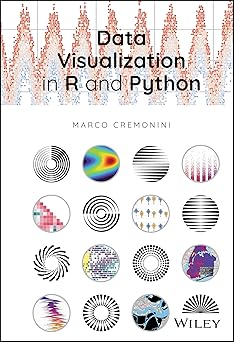
Data Visualization in R and Python
by: Marco Cremonini (Author)
Publisher: Wiley
Edition: 1st
Publication Date: 2024-12-12
Language: English
Print Length: 576 pages
ISBN-10: 1394289480
ISBN-13: 9781394289486
Book Description
Communicate the data that is powering our changing world with this essential textThe advent of machine learning and neural networks in recent years, along with other technologies under the broader umbrella of ‘artificial intelligence,’ has produced an explosion in Data Science research and applications. Data Visualization, which combines the technical knowledge of how to work with data and the visual and communication skills required to present it, is an integral part of this subject. The expansion of Data Science is already leading to greater demand for new approaches to Data Visualization, a process that promises only to grow. Data Visualization in R and Python offers a thorough overview of the key dimensions of this subject. Beginning with the fundamentals of data visualization with Python and R, two key environments for data science, the book proceeds to lay out a range of tools for data visualization and their applications in web dashboards, data science environments, graphics, maps, and more. With an eye towards remarkable recent progress in open-source systems and tools, this book offers a cutting-edge introduction to this rapidly growing area of research and technological development. Data Visualization in R and Python readers will also find:Coverage suitable for anyone with a foundational knowledge of R and PythonDetailed treatment of tools including the Ggplot2, Seaborn, and Altair libraries, Plotly/Dash, Shiny, and othersCase studies accompanying each chapter, with full explanations for data operations and logic for each, based on Open Data from many different sources and of different formatsData Visualization in R and Python is ideal for any student or professional looking to understand the working principles of this key field.
Editorial Reviews
Communicate the data that is powering our changing world with this essential textThe advent of machine learning and neural networks in recent years, along with other technologies under the broader umbrella of ‘artificial intelligence,’ has produced an explosion in Data Science research and applications. Data Visualization, which combines the technical knowledge of how to work with data and the visual and communication skills required to present it, is an integral part of this subject. The expansion of Data Science is already leading to greater demand for new approaches to Data Visualization, a process that promises only to grow. Data Visualization in R and Python offers a thorough overview of the key dimensions of this subject. Beginning with the fundamentals of data visualization with Python and R, two key environments for data science, the book proceeds to lay out a range of tools for data visualization and their applications in web dashboards, data science environments, graphics, maps, and more. With an eye towards remarkable recent progress in open-source systems and tools, this book offers a cutting-edge introduction to this rapidly growing area of research and technological development. Data Visualization in R and Python readers will also find:Coverage suitable for anyone with a foundational knowledge of R and PythonDetailed treatment of tools including the Ggplot2, Seaborn, and Altair libraries, Plotly/Dash, Shiny, and othersCase studies accompanying each chapter, with full explanations for data operations and logic for each, based on Open Data from many different sources and of different formatsData Visualization in R and Python is ideal for any student or professional looking to understand the working principles of this key field.
 Wow! eBook

